Alternative and real estate investments should be a part of every investment portfolio, with some experts recommending an allocation of over 30%. With stock and bond market volatility that can take drastic swings based on the day’s headlines, investors can take comfort in the security and stability that investing in a hard real estate asset such as self-storage can provide.
U.S. self-storage industry statistics: Updated 12/19/2018 Source: The SpareFoot Storage Beat.
| U.S. self-storage sector snapshot | Data |
|---|---|
| Annual industry revenue | $38 billion |
| Number of storage facilities (range) | 44,000-52,000 |
| Total rentable self-storage space | 2.3 billion square feet |
| Self-storage space per person | 7.06 square feet |
| Percentage of households that rent a self-storage unit | 9.4 percent |
| Average monthly cost for a self-storage unit | $91.14 |
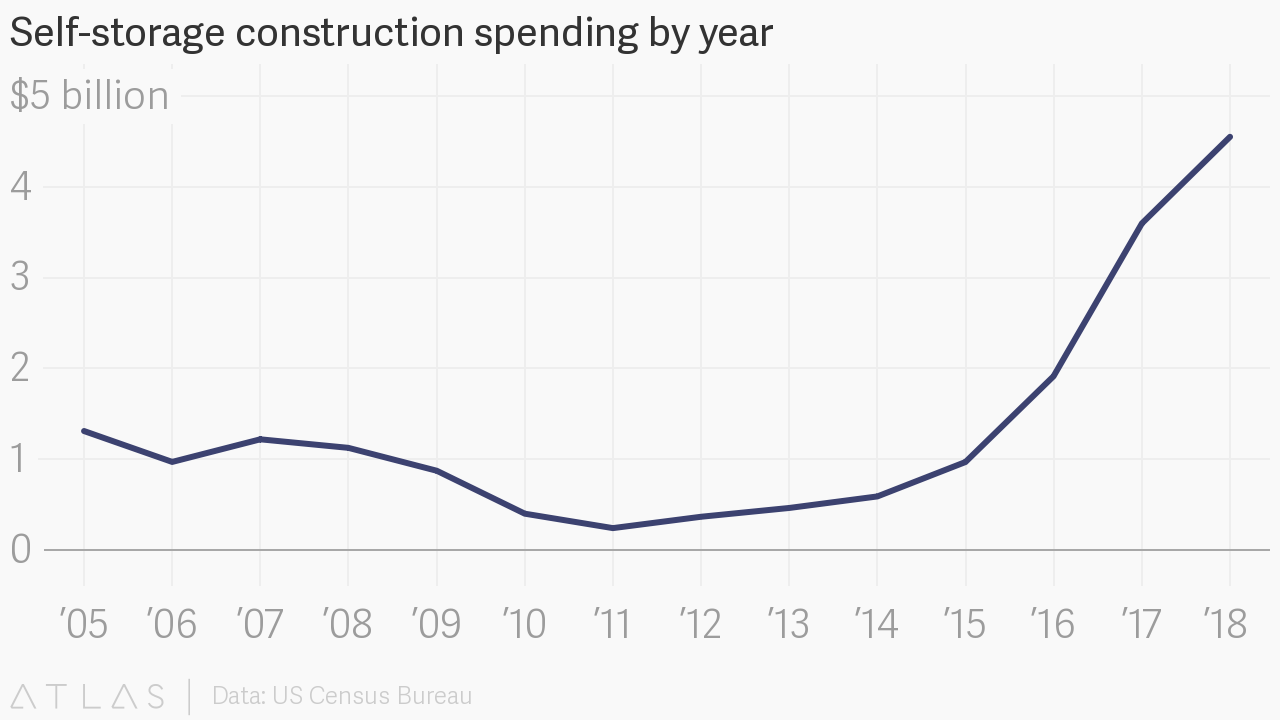
Average monthly construction spending on self-storage facilities
The chart below shows construction spending by month, according to the U.S. Census bureau. 2018 spending shown year-to-date through October 2018. Figures are not adjusted for inflation.
Largest self-storage operators (publicly traded) in the U.S. (by annual revenue)
- Public Storage: $2.51 billion (2017)
- Extra Space Storage: $1.1 billion (2017)
- CubeSmart: $558.94 million (2017)
- Life Storage: $529.75 million (2017)
- U-Haul: $286.89 million (fiscal 2017 – self-storage revenue only)
- National Storage Affiliates Trust: $268.13 million (2017)
Data from most recently reviewed company earnings reports.
Largest self-storage operators in the U.S. (by number of facilities, owned or managed)
- Public Storage: 2,386
- Extra Space Storage: 1,483
- U-Haul: 1,482
- CubeSmart: 936
- Life Storage: 675
- National Storage Affiliates Trust: 533
Data from most recently reviewed company earnings reports. U-Haul number reported by MiniCo Storage Almanac 2018.